hclusteasy
Determining Hierarchical Clustering Easily
Facilitates hierarchical clustering analysis with functions to read data in 'txt', 'xlsx', and 'xls' formats, apply normalization techniques to the dataset, perform hierarchical clustering and construct scatter plot from principal component analysis to evaluate the groups obtained.
hclusteasy 


Overview
The hclusteasy package simplifies HCA (Hierarchical Clustering Analysis)
by integrating essential functions from renowned R packages. It enables
data reading in .txt, .xlsx and .xls formats using utils and
readxl, offers data normalization techniques from the clusterSim,
performs hierarchical clustering analysis with the stats and conducts
PCA (Principal Component Analysis), plotting the first two components
using the stats and factoextra packages.
Packages Used in hclusteasy
For more information about the packages used in the development of hclusteasy, please visit their documentation on CRAN or their repositories on GitHub.
- utils: Documentation available in RStudio with
?utils - readxl: Documentation on CRAN and GitHub
- clusterSim: Documentation on CRAN
- stats: Documentation available in RStudio with
?stats - factoextra: Documentation on CRAN and GitHub
Table of Contents
Installation
You can install hclusteasy from GitHub using the devtools package:
# Install devtools if you haven't already
if (!requireNamespace("devtools", quietly = TRUE)) {
  install.packages("devtools")
}

# Install the hclusteasy package directly from GitHub
devtools::install_github("tsukubai/hclusteasy")
Introduction
hclusteasy is designed to streamline the process of hierarchical clustering analysis by integrating essential functions from popular R packages. The main goal of this package is to provide an easy-to-use interface for reading data, performing data normalization, conducting hierarchical clustering, and visualizing results through PCA.
Datasets
| Dataset | Description |
|---|---|
| iris_uci | The Iris dataset is a classic dataset used for analysis and machine learning, containing 150 samples of iris flowers from three different species: Iris setosa, Iris versicolor, and Iris virginica. Each sample has four morphological features: sepal length, sepal width, petal length, and petal width, measured in centimeters. Created by Ronald A. Fisher in 1936, the dataset is often used for testing classification algorithms. |
| wine_uci | The Wine dataset is a well-known dataset used for classification and clustering in machine learning, containing chemical analysis results of wines grown in the same region in Italy but derived from three different cultivars. The dataset comprises 178 samples, each described by 13 continuous attributes such as alcohol content, malic acid, ash, and flavanoids. Created by Forina et al., it is commonly used to test the performance of various classification algorithms. |
Functions
| Functions | Description |
|---|---|
| read.data | Reads data from different formats (txt, xlsx, xls) for analysis. |
| normalization | Applies data normalization techniques. |
| hca | Performs hierarchical clustering analysis on the data using Euclidean distance and returns the generated groups. |
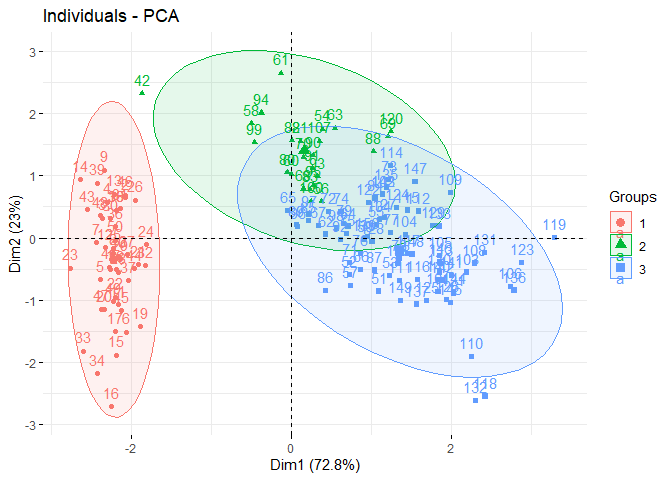
| pca | Performs principal component analysis and generates a scatter plot from the first two principal components. |
Usage
# Library
library(hclusteasy)
Read iris dataset in xlsx format
# File path: 'iris_uci.xlsx'
file_path <- system.file("extdata",
                         "iris_uci.xlsx",
                         package = "hclusteasy")


# Read iris in xlsx format
iris <- read.data(file_path, col.names = TRUE)


iris[1:3,]
#>   sepal.length sepal.width petal.length petal.width Species
#> 1          5.1         3.5          1.4         0.2  setosa
#> 2          4.9         3.0          1.4         0.2  setosa
#> 3          4.7         3.2          1.3         0.2  setosa
Data normalization
# Remove "Species" column
iris <- iris[,-5]

# Data normalization using Z-score type, by column
irisN <- normalization(iris, type = "n1", norm = "column")

irisN[1:3,]
#>   sepal.length sepal.width petal.length petal.width
#> 1   -0.8976739   1.0286113    -1.336794   -1.308593
#> 2   -1.1392005  -0.1245404    -1.336794   -1.308593
#> 3   -1.3807271   0.3367203    -1.393470   -1.308593
Generate hierarchical groups
# Perform hierarchical clustering analysis
# and return hierarchical groups
g <- hca(irisN, method = "complete", num.groups = 3)

g[1:10]
#>  1  2  3  4  5  6  7  8  9 10
#>  1  1  1  1  1  1  1  1  1  1
Plot principal component analysis
# Plot PCA considering the generated hierarchical groups
pca(irisN, groups = g)