geoarrowWidget
Attach '(Geo)Arrow' and/or '(Geo)Parquet' Data to a Widget
Provides functions and necessary 'JavaScript' bindings to quickly transfer spatial data from R memory or remote URLs to the browser for use in interactive 'HTML' widgets created with the 'htmlwidgets' R package. Leverages 'GeoArrow' (< https://geoarrow.org/>) data representation for data stored in local R memory which is generally faster than traditional 'GeoJSON' by minimising the amount of copy, serialization and deserialization steps necessary for the data transfer. Furthermore, provides functionality and 'JavaScript' bindings to consume 'GeoParquet' (< https://geoparquet.org/>) files from remote URLs in the browser.

geoarrowWidget
The aim of geoarrowWidget is to facilitate fast transfer of geospatial
data between R memory and the browser using GeoArrow memory layout. It
also provides JavaScript bindings for reading GeoParquet files from
remote URLs. It provides functionality to attach GeoArrow and/or
GeoParuet data to existing htmlwidgets along with the relevant
JavaScript libraries to handle this data in the browser context.
It does not do anything useful beyond the data transfer. It is up to the
user/devloper to make further use of this data, e.g. render it somehow,
using JavaScript.
In theory, all functionality provided by geoarrowWidget will also work
for the native, i.e. non-geospatial implementations of Arrow and
Parquet data, but those are not thoroughly tested.
Installation
Not on CRAN yet, so install from github:
remotes::install_github("r-spatial/geoarrowWidget")
Usage example
For testing purposes, geoarrowWidget provides a minimal htmlwidget
called geoarrowDummyWidget. Here’s an example of how to use it:
library(geoarrowWidget)
library(wk)
library(nanoarrow)
library(geoarrow)

### generate some random sf points data ========================================
n = 1e5
dat = data.frame(
  id = 1:n
  , geometry = xy(
    x = runif(n, -160, 160)
    , y = runif(n, -40, 40)
    , crs = 4326
  )
)

### setup and write to tempfile as geoarrow ====================================
fl = tempfile()
dir.create(fl)
path = file.path(
  fl
  , "test.arrow"
)

interleaved = FALSE

data_stream = nanoarrow::as_nanoarrow_array_stream(
  dat
  , geometry_schema = geoarrow::infer_geoarrow_schema(
    dat
    , coord_type = ifelse(interleaved, "INTERLEAVED", "SEPARATE")
  )
)

nanoarrow::write_nanoarrow(data_stream, path)

### create widget and check browser console ====================================
wgt = geoarrowDummyWidget(file = path)

options(viewer = NULL)

wgt
This will create a web page with the data attached as a geoarrow object. In the browser console (press F12) this will look something like this (depending on the browser obviously, Librewolf in this case). You should see two entries:
Object- the geoarrow dataPerformanceResourceTiming- details about the performance of loading the data includingencodedBodySizeof the data in Bytes anddurationin milliseconds.
Another way to see how long it takes to load the data is to open the
Network tab in the developer tools and refresh the page.
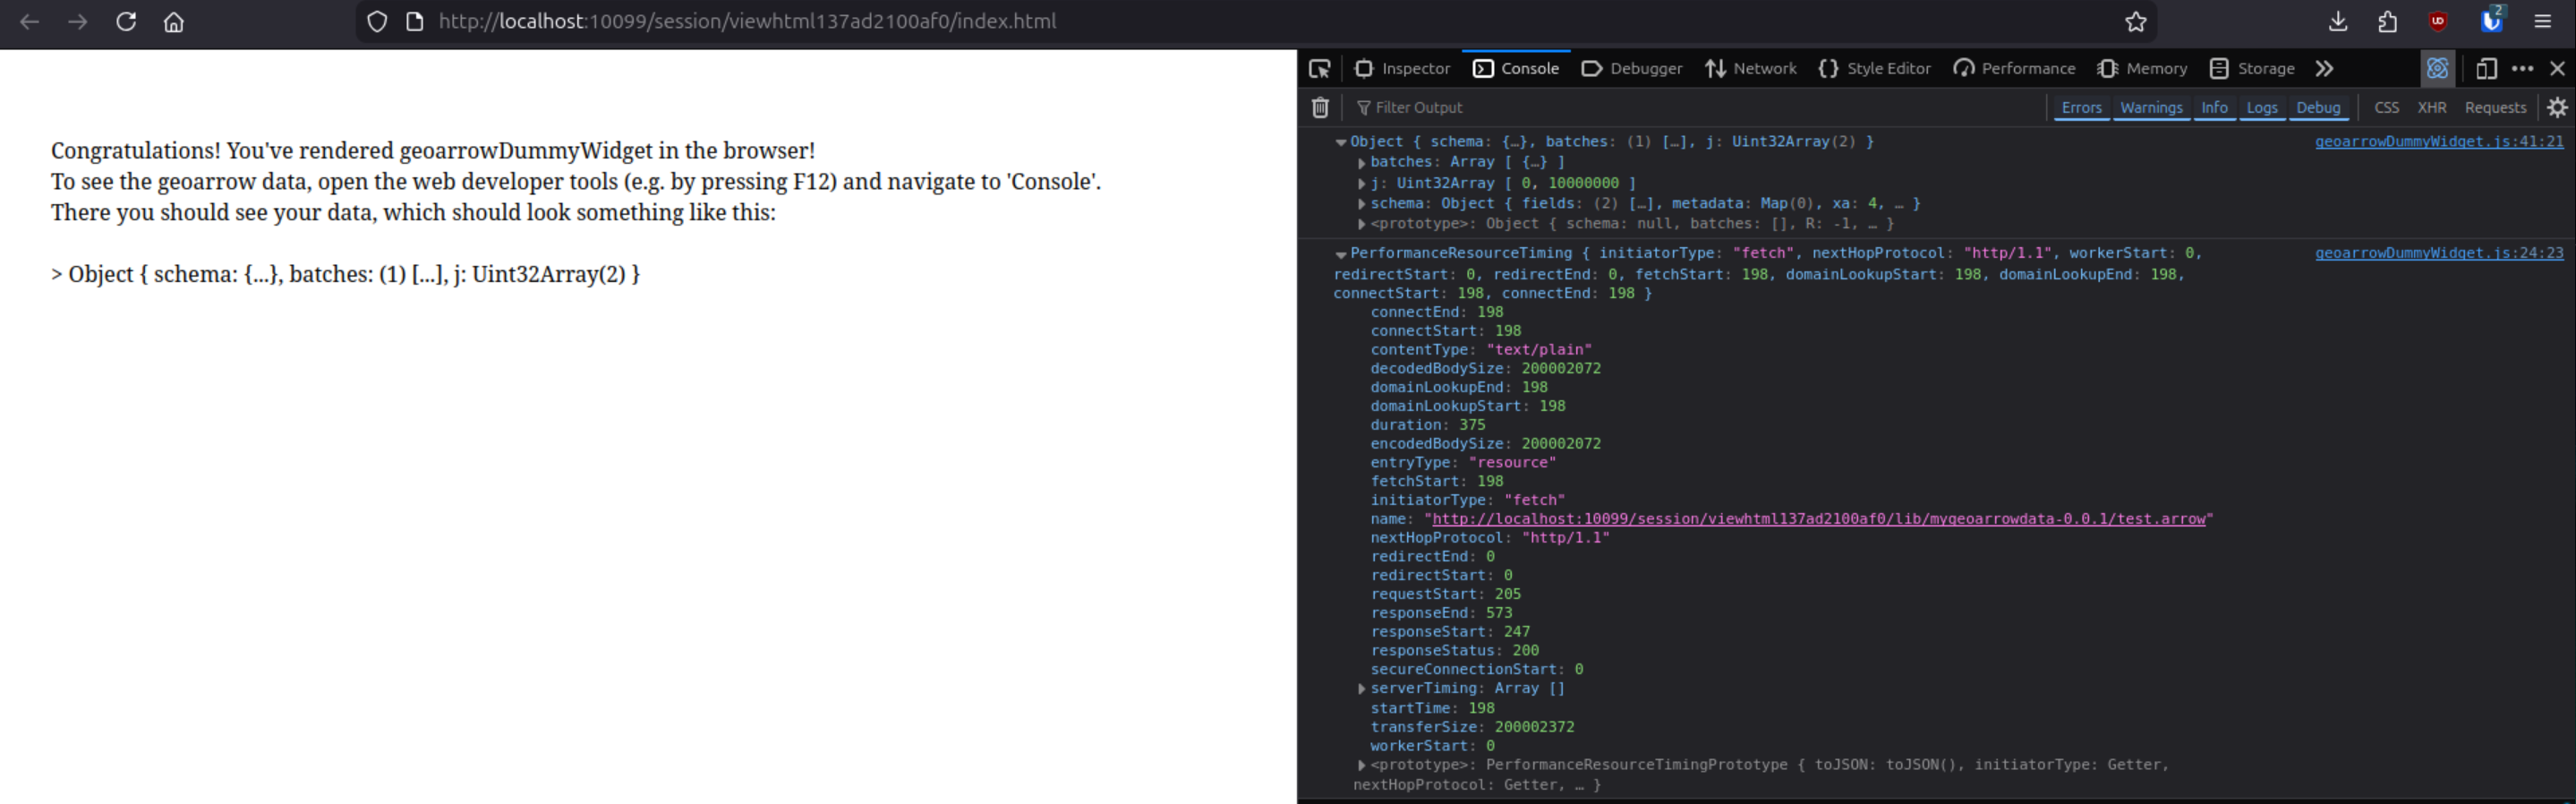 Note: the 200MB
 encodedBodySize
and 375ms duration in the screenshot are the result of running the
above code with 1e7 points.
The page source (press <CTRL + u>) will look something like this, where in line 11 you see the attached test.arrow file and above the necessary scripts (arrow and geoarrow JS bindings) to process the data further in JavaScript.

The general usage pattern is highlighted in these lines of
geoarrowDummyWidget
Acknowledgment
This project has been realized with financial support from the